#Stats were pulled from Basketball Reference.com
library(rvest) #version 0.3.6
library(dplyr)
library(hablar) #Used to convert data types
library(ggplot2) #graphing
library(stringr) #spliting columns
Fultz2021 <- "https://www.basketball-reference.com/players/f/fultzma01/gamelog/2021/"
read_html(Fultz2021)
url <- Fultz2021
pageobj <- read_html(url, as.data.frame=T, stringsAsFactors = TRUE)
#Here, we indicate that this is the table we want to extract.
pageobj %>%
html_nodes("table") %>%
.[[8]] %>%
html_table(fill=T) -> Fultz2021
Fultz2021 <- Fultz2021[!(Fultz2021$GS=="Did Not Play" | Fultz2021$GS=="Did Not Dress" | Fultz2021$GS=="GS" | Fultz2021$GS == "Inactive"),]
names(Fultz2021)[names(Fultz2021) == "Rk"] <- "TeamGame"
names(Fultz2021)[names(Fultz2021) == "G"] <- "PlayerGame"
names(Fultz2021)[names(Fultz2021) == "Tm"] <- "Team"
colnames(Fultz2021)[6] <-c("Location")
names(Fultz2021)[names(Fultz2021) == "Opp"] <- "Opponent"
colnames(Fultz2021)[8] <-c("WinLoss")
names(Fultz2021)[names(Fultz2021) == "GS"] <- "GameStarted"
names(Fultz2021)[names(Fultz2021) == "MP"] <- "MinsPlayed"
Fultz2021$Location <- ifelse(Fultz2021$Location == "@", "Away", "Home")
Index <- str_split_fixed(Fultz2021$MinsPlayed, ":", 2) #Create County Index Matrix
Fultz2021 <- cbind(Fultz2021, Index) #Add CountyIndex Matrix to CountyIncome DataFrame
names(Fultz2021)[names(Fultz2021) == "1"] <- "Minutes"
names(Fultz2021)[names(Fultz2021) == "2"] <- "Seconds"
Index <- str_split_fixed(Fultz2021$WinLoss, " ", 2) #Create County Index Matrix
Fultz2021 <- cbind(Fultz2021, Index) #Add CountyIndex Matrix to CountyIncome DataFrame
Fultz2021<- Fultz2021 %>% select(-WinLoss) #remove columns
names(Fultz2021)[names(Fultz2021) == "1"] <- "WinLoss"
Fultz2021<- Fultz2021 %>% select(-"2")
colnames(Fultz2021)
Fultz2021 <- Fultz2021 %>% convert( int("TeamGame", "PlayerGame", "FG", "FGA", "3P", "3PA", "FT", "FTA", "ORB", "DRB", "TRB", "AST", "STL", "BLK", "TOV", "PF", "PTS", "+/-" ), num("FG%", "3P%", "FT%", "FG%", "FT%", "3P%", "GmSc"), dte("Date"), fct("Team", "Location", "Opponent", "WinLoss", "GameStarted"))
#Create a vector that counts how many columns are in the data frame ColNumber <- (seq_len(ncol(Fultz2021))) #Turn the vector into its own data frame with the first column called ColNumber DataDictionary <- as.data.frame(ColNumber) #Add a column based on the vector of colnames DataDictionary$VariableName <- (colnames(Fultz2021)) #Add the variable type into the data frame as a new column called "type" DataDictionary$DataType <- (sapply(Fultz2021, class)) View(DataDictionary)
ggplot(Fultz2021, aes(x = Minutes, y = GmSc)) + geom_point() + ggtitle("Fultz 2020-2021") + xlab("Minutes Played") + ylab("Game Score") + theme_classic() + theme(axis.text.x = element_blank(), axis.ticks = element_blank(), axis.line = element_line(linetype = "blank"))
Fultz2020 <- "https://www.basketball-reference.com/players/f/fultzma01/gamelog/2020"
read_html(Fultz2020)
url <- Fultz2020
pageobj <- read_html(url, as.data.frame=T, stringsAsFactors = TRUE)
pageobj %>%
html_nodes("table") %>%
.[[8]] %>%
html_table(fill=T) -> Fultz2020
Fultz2020 <- Fultz2020[!(Fultz2020$GS=="Did Not Play" | Fultz2020$GS=="Did Not Dress" | Fultz2020$GS=="GS" | Fultz2020$GS == "Inactive"),]
names(Fultz2020)[names(Fultz2020) == "Rk"] <- "TeamGame"
names(Fultz2020)[names(Fultz2020) == "G"] <- "PlayerGame"
names(Fultz2020)[names(Fultz2020) == "Tm"] <- "Team"
colnames(Fultz2020)[6] <-c("Location")
names(Fultz2020)[names(Fultz2020) == "Opp"] <- "Opponent"
colnames(Fultz2020)[8] <-c("WinLoss")
names(Fultz2020)[names(Fultz2020) == "GS"] <- "GameStarted"
names(Fultz2020)[names(Fultz2020) == "MP"] <- "MinsPlayed"
Fultz2020$Location <- ifelse(Fultz2020$Location == "@", "Away", "Home")
Index <- str_split_fixed(Fultz2020$MinsPlayed, ":", 2) #Create County Index Matrix
Fultz2020 <- cbind(Fultz2020, Index) #Add CountyIndex Matrix to CountyIncome DataFrame
names(Fultz2020)[names(Fultz2020) == "1"] <- "Minutes"
names(Fultz2020)[names(Fultz2020) == "2"] <- "Seconds"
Index <- str_split_fixed(Fultz2020$WinLoss, " ", 2) #Create County Index Matrix Fultz2020 <- cbind(Fultz2020, Index) #Add CountyIndex Matrix to CountyIncome DataFrame Fultz2020<- Fultz2020 %>% select(-WinLoss) #remove columns names(Fultz2020)[names(Fultz2020) == "1"] <- "WinLoss" Fultz2020<- Fultz2020 %>% select(-"2")
colnames(Fultz2020) Fultz2020 <- Fultz2020 %>% convert( int("TeamGame", "PlayerGame", "FG", "FGA", "3P", "3PA", "FT", "FTA", "ORB", "DRB", "TRB", "AST", "STL", "BLK", "TOV", "PF", "PTS", "+/-" ), num("FG%", "3P%", "FT%", "FG%", "FT%", "3P%", "GmSc"), dte("Date"), fct("Team", "Location", "Opponent", "WinLoss", "GameStarted"))
#Create a vector that counts how many columns are in the data frame ColNumber <- (seq_len(ncol(Fultz2020))) #Turn the vector into its own data frame with the first column called ColNumber DataDictionary <- as.data.frame(ColNumber) #Add a column based on the vector of colnames DataDictionary$VariableName <- (colnames(Fultz2020)) #Add the variable type into the data frame as a new column called "type" DataDictionary$DataType <- (sapply(Fultz2020, class)) View(DataDictionary)
ggplot(Fultz2020, aes(x = Minutes, y = GmSc)) + geom_jitter() + ggtitle("Fultz 2019-2020") + xlab("Minutes Played") + ylab("Game Score") + theme_classic() + theme(axis.text.x = element_blank(), axis.ticks = element_blank(), axis.line = element_line(linetype = "blank"))
Fultz2019 <- "https://www.basketball-reference.com/players/f/fultzma01/gamelog/2019" read_html(Fultz2019)
url <- Fultz2019
pageobj <- read_html(url, as.data.frame=T, stringsAsFactors = TRUE)
#Here, we indicate that this is the table we want to extract.
pageobj %>%
html_nodes("table") %>%
.[[8]] %>%
html_table(fill=T) -> Fultz2019
Fultz2019 <- Fultz2019[!(Fultz2019$GS=="Did Not Play" | Fultz2019$GS=="Did Not Dress" | Fultz2019$GS=="GS" | Fultz2019$GS == "Inactive"),]
names(Fultz2019)[names(Fultz2019) == "Rk"] <- "TeamGame" names(Fultz2019)[names(Fultz2019) == "G"] <- "PlayerGame" names(Fultz2019)[names(Fultz2019) == "Tm"] <- "Team" colnames(Fultz2019)[6] <-c("Location") names(Fultz2019)[names(Fultz2019) == "Opp"] <- "Opponent" colnames(Fultz2019)[8] <-c("WinLoss") names(Fultz2019)[names(Fultz2019) == "GS"] <- "GameStarted" names(Fultz2019)[names(Fultz2019) == "MP"] <- "MinsPlayed"
Fultz2019$Location <- ifelse(Fultz2019$Location == "@", "Away", "Home")
Index <- str_split_fixed(Fultz2019$MinsPlayed, ":", 2) #Create County Index Matrix Fultz2019 <- cbind(Fultz2019, Index) #Add CountyIndex Matrix to CountyIncome DataFrame names(Fultz2019)[names(Fultz2019) == "1"] <- "Minutes" names(Fultz2019)[names(Fultz2019) == "2"] <- "Seconds"
Index <- str_split_fixed(Fultz2019$WinLoss, " ", 2) #Create County Index Matrix Fultz2019 <- cbind(Fultz2019, Index) #Add CountyIndex Matrix to CountyIncome DataFrame Fultz2019<- Fultz2019 %>% select(-WinLoss) #remove columns names(Fultz2019)[names(Fultz2019) == "1"] <- "WinLoss" Fultz2019<- Fultz2019 %>% select(-"2")
#library(hablar) colnames(Fultz2019) Fultz2019 <- Fultz2019 %>% convert( int("TeamGame", "PlayerGame", "FG", "FGA", "3P", "3PA", "FT", "FTA", "ORB", "DRB", "TRB", "AST", "STL", "BLK", "TOV", "PF", "PTS", "+/-" ), num("FG%", "3P%", "FT%", "FG%", "FT%", "3P%", "GmSc"), dte("Date"), fct("Team", "Location", "Opponent", "WinLoss", "GameStarted"))
#Create a vector that counts how many columns are in the data frame ColNumber <- (seq_len(ncol(Fultz2019))) #Turn the vector into its own data frame with the first column called ColNumber DataDictionary <- as.data.frame(ColNumber) #Add a column based on the vector of colnames DataDictionary$VariableName <- (colnames(Fultz2019)) #Add the variable type into the data frame as a new column called "type" DataDictionary$DataType <- (sapply(Fultz2019, class)) View(DataDictionary)
ggplot(Fultz2019, aes(x = Minutes, y = GmSc)) + geom_jitter() + ggtitle("Fultz 2019-2020") + xlab("Minutes Played") + ylab("Game Score") + theme_classic() + theme(axis.text.x = element_blank(), axis.ticks = element_blank(), axis.line = element_line(linetype = "blank"))
Fultz2018 <- "https://www.basketball-reference.com/players/f/fultzma01/gamelog/2018" read_html(Fultz2018)
url <- Fultz2018
pageobj <- read_html(url, as.data.frame=T, stringsAsFactors = TRUE)
#Here, we indicate that this is the table we want to extract.
pageobj %>%
html_nodes("table") %>%
.[[8]] %>%
html_table(fill=T) -> Fultz2018
Fultz2018 <- Fultz2018[!(Fultz2018$GS=="Did Not Play" | Fultz2018$GS=="Did Not Dress" | Fultz2018$GS=="GS" | Fultz2018$GS == "Inactive"),]
names(Fultz2018)[names(Fultz2018) == "Rk"] <- "TeamGame" names(Fultz2018)[names(Fultz2018) == "G"] <- "PlayerGame" names(Fultz2018)[names(Fultz2018) == "Tm"] <- "Team" colnames(Fultz2018)[6] <-c("Location") names(Fultz2018)[names(Fultz2018) == "Opp"] <- "Opponent" colnames(Fultz2018)[8] <-c("WinLoss") names(Fultz2018)[names(Fultz2018) == "GS"] <- "GameStarted" names(Fultz2018)[names(Fultz2018) == "MP"] <- "MinsPlayed"
Fultz2018$Location <- ifelse(Fultz2018$Location == "@", "Away", "Home")
Index <- str_split_fixed(Fultz2018$MinsPlayed, ":", 2) #Create County Index Matrix Fultz2018 <- cbind(Fultz2018, Index) #Add CountyIndex Matrix to CountyIncome DataFrame names(Fultz2018)[names(Fultz2018) == "1"] <- "Minutes" names(Fultz2018)[names(Fultz2018) == "2"] <- "Seconds"
Index <- str_split_fixed(Fultz2018$WinLoss, " ", 2) #Create County Index Matrix Fultz2018 <- cbind(Fultz2018, Index) #Add CountyIndex Matrix to CountyIncome DataFrame Fultz2018<- Fultz2018 %>% select(-WinLoss) #remove columns names(Fultz2018)[names(Fultz2018) == "1"] <- "WinLoss" Fultz2018<- Fultz2018 %>% select(-"2")
#library(hablar) colnames(Fultz2018) Fultz2018 <- Fultz2018 %>% convert( int("TeamGame", "PlayerGame", "FG", "FGA", "3P", "3PA", "FT", "FTA", "ORB", "DRB", "TRB", "AST", "STL", "BLK", "TOV", "PF", "PTS", "+/-" ), num("FG%", "3P%", "FT%", "FG%", "FT%", "3P%", "GmSc"), dte("Date"), fct("Team", "Location", "Opponent", "WinLoss", "GameStarted"))
#Create a vector that counts how many columns are in the data frame ColNumber <- (seq_len(ncol(Fultz2018))) #Turn the vector into its own data frame with the first column called ColNumber DataDictionary <- as.data.frame(ColNumber) #Add a column based on the vector of colnames DataDictionary$VariableName <- (colnames(Fultz2018)) #Add the variable type into the data frame as a new column called "type" DataDictionary$DataType <- (sapply(Fultz2018, class)) View(DataDictionary)
ggplot(Fultz2018, aes(x = Minutes, y = GmSc)) + geom_jitter() + ggtitle("Fultz 2019-2020") + xlab("Minutes Played") + ylab("Game Score") + theme_classic() + theme(axis.text.x = element_blank(), axis.ticks = element_blank(), axis.line = element_line(linetype = "blank"))
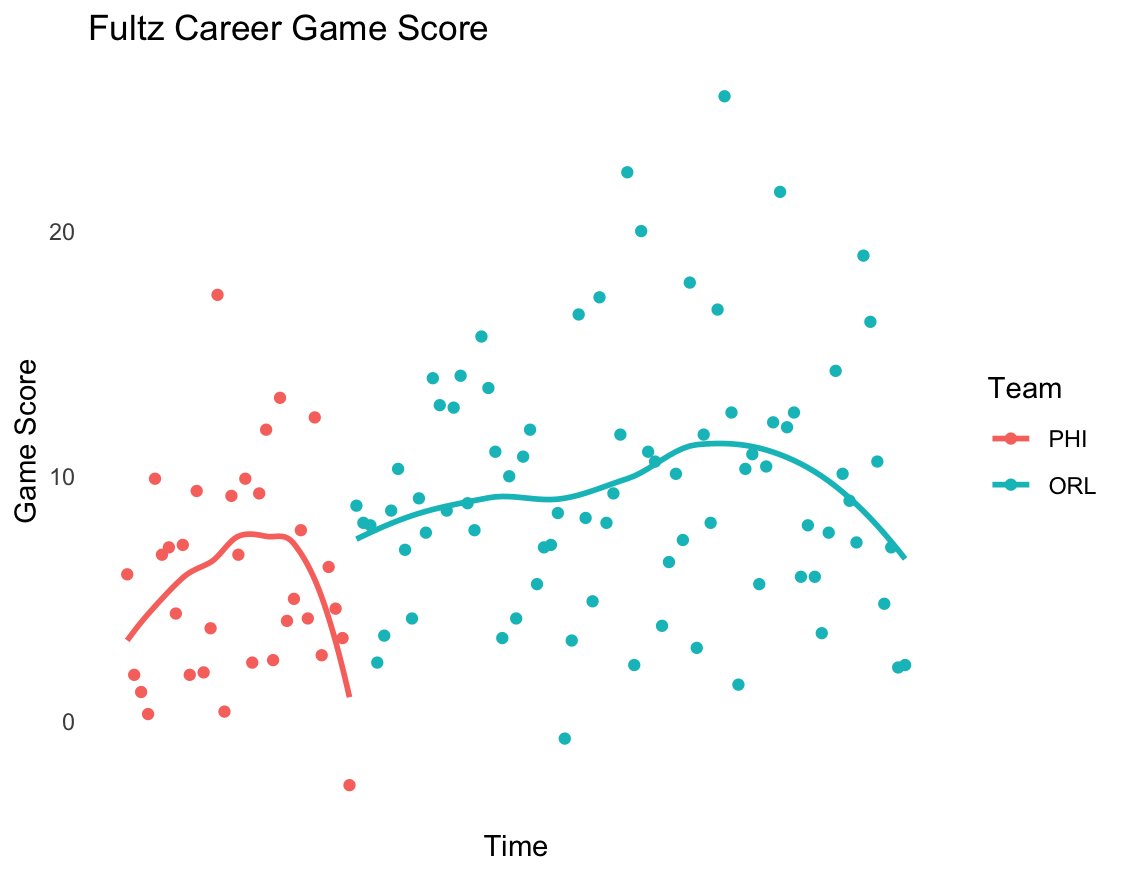
Fultz <- rbind(Fultz2018, Fultz2019, Fultz2020, Fultz2021) Fultz$PlayerGame <- seq.int(nrow(Fultz)) Fultz$Player <- "Fultz"
ggplot(Fultz, aes(x = PlayerGame, y = GmSc, color = Team)) + geom_point() + geom_smooth(se= FALSE) + ggtitle("Fultz Career Game Score") + xlab("Time") + ylab("Game Score") + theme_classic() + theme(axis.text.x = element_blank(), axis.ticks = element_blank(), axis.line = element_line(linetype = "blank"))