-
Notifications
You must be signed in to change notification settings - Fork 3
Expand file tree
/
Copy pathharmony_r_example.Rmd
More file actions
220 lines (156 loc) · 6.46 KB
/
harmony_r_example.Rmd
File metadata and controls
220 lines (156 loc) · 6.46 KB
1
2
3
4
5
6
7
8
9
10
11
12
13
14
15
16
17
18
19
20
21
22
23
24
25
26
27
28
29
30
31
32
33
34
35
36
37
38
39
40
41
42
43
44
45
46
47
48
49
50
51
52
53
54
55
56
57
58
59
60
61
62
63
64
65
66
67
68
69
70
71
72
73
74
75
76
77
78
79
80
81
82
83
84
85
86
87
88
89
90
91
92
93
94
95
96
97
98
99
100
101
102
103
104
105
106
107
108
109
110
111
112
113
114
115
116
117
118
119
120
121
122
123
124
125
126
127
128
129
130
131
132
133
134
135
136
137
138
139
140
141
142
143
144
145
146
147
148
149
150
151
152
153
154
155
156
157
158
159
160
161
162
163
164
165
166
167
168
169
170
171
172
173
174
175
176
177
178
179
180
181
182
183
184
185
186
187
188
189
190
191
192
193
194
195
196
197
198
199
200
201
202
203
204
205
206
207
208
209
210
211
212
213
214
215
216
217
218
219
---
title: Harmony R Walkthrough
output:
html_document:
df_print: paged
---
# Harmony walkthrough - R library

This notebook shows how you can use Harmony to find the similarity matrix between two questionnaires.
The Harmony project is a data harmonisation project that uses [Natural Language Processing](https://fastdatascience.com/guide-natural-language-processing-nlp/) to help researchers make better use of existing data from different studies by supporting them with the harmonisation of various measures and items used in different studies.
Harmony is a collaboration project between [Ulster University](https://ulster.ac.uk/), [University College London](https://ucl.ac.uk/), the [Universidade Federal de Santa Maria](https://www.ufsm.br/), and [Fast Data Science](http://fastdatascience.com/). Harmony is funded by [Wellcome](https://wellcome.org/) as part of the [Wellcome Data Prize in Mental Health](https://wellcome.org/grant-funding/schemes/wellcome-mental-health-data-prize).
First let's install and import Harmony. If you haven't already, you need to install it with `install.packages("harmonydata")`.
```{r}
#install.packages("harmonydata")
```
```{r}
library(harmonydata)
```
```{r, echo=FALSE}
#set_url("localhost:8000")
```
Now we can create our instruments.
If you had everything in a PDF or Excel file, you could load the instruments directly from the file: `instrument = load_instruments_from_file(path = "CBCL_GOASSESS.xlsx")`.
In this example we will load two questionnaires from Harmony's database and manually input a third questionnaire.
First we load the instruments from Harmony's database:
```{r}
example_instruments <- get_example_instruments()
names(example_instruments)
```
Let's use the CES-D English, GAD-7 Portuguese and create a GAD-7 Norwegian instrument.
```{r}
ces_d_english <- example_instruments[["CES_D English"]]
gad_7_portuguese <- example_instruments[["GAD-7 Portuguese"]]
gad_7_norwegian <- create_instrument_from_list(
list(
"Følt deg nervøs, engstelig eller veldig stresset",
"Ikke klart å slutte å bekymre deg eller kontrolleren bekymringene dine"
),
instrument_name = "GAD-7 Norwegian"
)
```
We can concatenate our instruments together:
```{r}
instruments_list <- list(ces_d_english, gad_7_portuguese, gad_7_norwegian)
```
Let’s call Harmony to calculate the match:
```{r}
match <- match_instruments(instruments_list, topics=list("anxiety", "depression", "bother"))
```
We also
```{r}
help(match_instruments)
```
**Check** what has come out of the match:
```{r}
names(match)
```
The first question is CES_D English question 1.
```{r}
match$questions[[1]]
```
The total number of questions is:
```{r}
length(match$questions)
```
We can view the first few rows of the similarity matrix for the questions.
```{r}
head(match$matches)
```
We can also plot a heat map of the questions similarity matrix. Please bare in mind however that R will compress the matrix to fit the size of the plotting area, which may reduce the visible resolution for large matrices.
```{r}
heatmap(as.matrix(match$matches),
Rowv = NA, Colv = NA, main = "Questions Similarity Matrix",
margins = c(10, 10))
```
We can view the first few rows of the similarity matrix for the response options.
```{r}
head(match$response_options_similarity)
```
We can also plot a heat map of the response options similarity matrix.
```{r}
heatmap(as.matrix(match$response_options_similarity),
Rowv = NA, Colv = NA, main = "Response Options Similarity Matrix",
margins = c(10, 10))
```
## Generate a Crosswalk table
We can generate a crosswalk table to match questions with a cosine similarity above a certain threshold.
```{r}
threshold <- 0.7
df_crosswalk_table <- generate_crosswalk_table(
match$instruments,
match$matches,
threshold,
is_allow_within_instrument_matches = TRUE,
is_enforce_one_to_one = TRUE
)
df_crosswalk_table
```
## Cluster the questions
Display the clusters and cluster keywords that come out of Harmony by default.
```{r}
for (i in seq_along(match$clusters)) {
print(paste0("Cluster ", match$clusters[[i]]$cluster_id, ": ", match$clusters[[i]]$text_description))
keywords <- c()
for (j in seq_along(match$clusters[[i]]$keywords)) {
keywords <- c(keywords, match$clusters[[i]]$keywords[[j]])
}
keywords_output <- paste("Keywords:", paste(keywords, collapse = ", "))
print(keywords_output)
for (j in seq_along(match$clusters[[i]]$item_ids)) {
id <- match$clusters[[i]]$item_ids[[j]]
print(paste(" ", match$questions[[id]]$question_text))
}
}
```
We can also choose between different clustering algorithms for the matcher to use.
```{r}
match <- match_instruments(instruments_list, clustering_algorithm = "kmeans")
for (i in seq_along(match$clusters)) {
print(paste0("Cluster ", match$clusters[[i]]$cluster_id, ": ", match$clusters[[i]]$text_description))
keywords <- c()
for (j in seq_along(match$clusters[[i]]$keywords)) {
keywords <- c(keywords, match$clusters[[i]]$keywords[[j]])
}
keywords_output <- paste("Keywords:", paste(keywords, collapse = ", "))
print(keywords_output)
for (j in seq_along(match$clusters[[i]]$item_ids)) {
id <- match$clusters[[i]]$item_ids[[j]]
print(paste(" ", match$questions[[id]]$question_text))
}
}
```
## Display the similarities between instruments
Let's display the similarities between the instruments.
```{r}
for (i in seq_along(match$instrument_to_instrument_similarities)) {
obj <- match$instrument_to_instrument_similarities[[i]]
print(paste("F1 similarity of", obj$instrument_1_name, "to", obj$instrument_2_name, "is", obj$f1))
}
```
## Saving to CSV/Excel
We can simply export the `match$matches` data frame to a CSV file.
```{r}
write.csv(match$matches, "matches.csv")
```
Similarly we can export `df_crosswalk_table`.
```{r}
write.csv(df_crosswalk_table, "crosswalk_table.csv")
```
If you open the CSV generated, you can see the complete matrix. You can also open in Excel.
You can also see the file in Google Colab online by going into the file system on the left panel (see below screenshot).
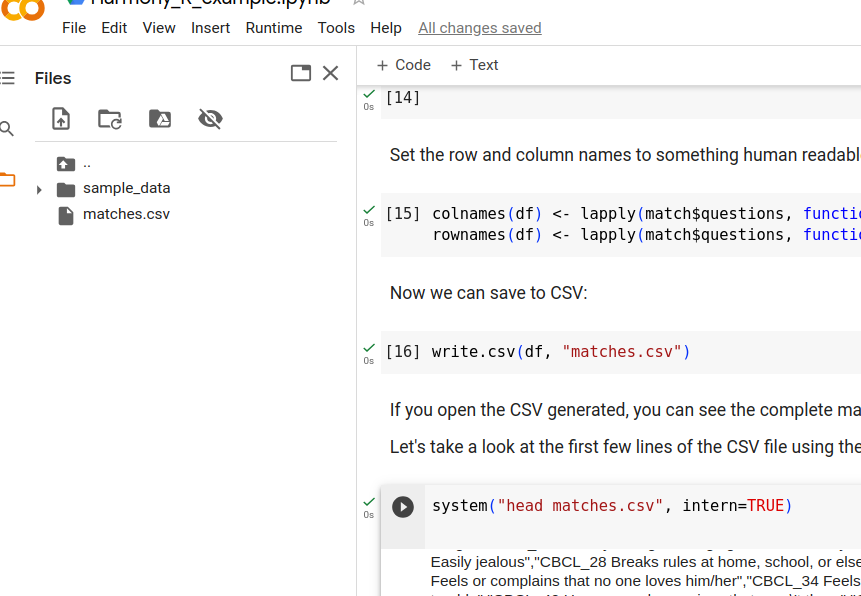
Let's take a look at the first few lines of the CSV file using the Bash command `head`:
```{r}
#system("head matches.csv", intern = TRUE)
```