Setting up Grafana for a single line time series graph is pretty simple.
After defining the CSV data source as described in the CSVServer readme file,
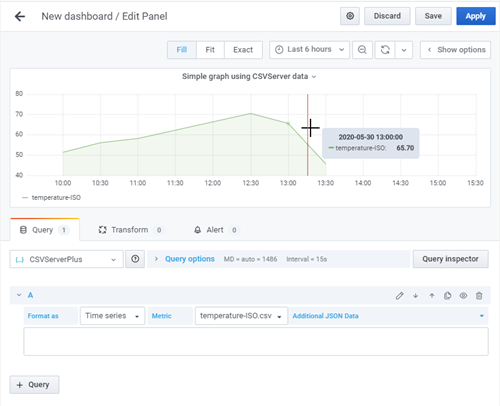
Using a simple CSV file such as the sample temperature-ISO.csv provided:
date,temperature-ISO
2020-05-30 10:00:00.000,51.5
2020-05-30 10:30:00.000,56.2
2020-05-30 11:00:00.000,58.3
2020-05-30 11:30:00.000,62.4
2020-05-30 12:00:00.000,66.5
2020-05-30 12:30:00.000,70.6
2020-05-30 13:00:00.000,65.7
2020-05-30 13:30:00.000,45.8
Select this file in Grafana's query window:
A few things to notice.
- The column names can be anything, and can be in any order.
- The date/time field uses the default name 'date' - CSVServer can be configured n various ways to use a a comma separated list of field names for this purpose, overriding the 'date' default.
- The name of the line in Grafana comes from the CSV file's value column (Temperature-ISO in this case).
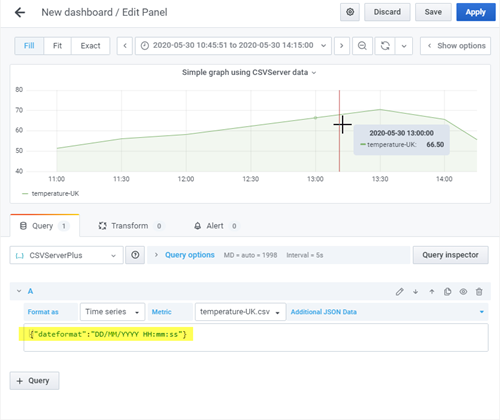
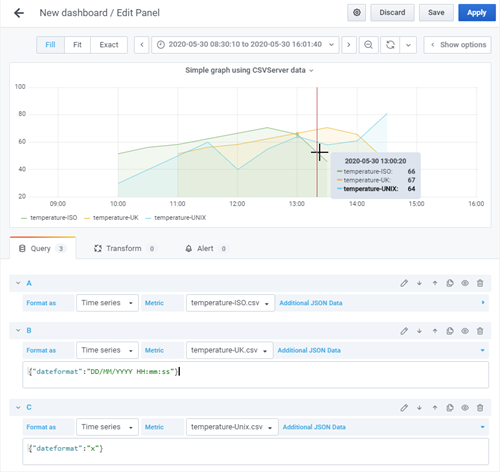
By default, CSVFile dates should be in ISO format - that is, 'YYYY-MM-DD HH:mm:ss'. The default for this and everything else is defined in the default.ini file. Alternatively, the date format and everything else can be overridden by the individual query (only when using the simPod JSON datasource). So a CSV File with UK/European-formatted date values such as this:
date,temperature-UK
30/05/2020 11:00:00.000,51.5
30/05/2020 11:30:00.000,56.2
30/05/2020 12:00:00.000,58.3
30/05/2020 12:30:00.000,62.4
30/05/2020 13:00:00.000,66.5
30/05/2020 13:30:00.000,70.6
30/05/2020 14:00:00.000,65.7
30/05/2020 14:30:00.000,45.8
Can be read in by overriding the dateformat in the additional data field of the simPod.JSON query
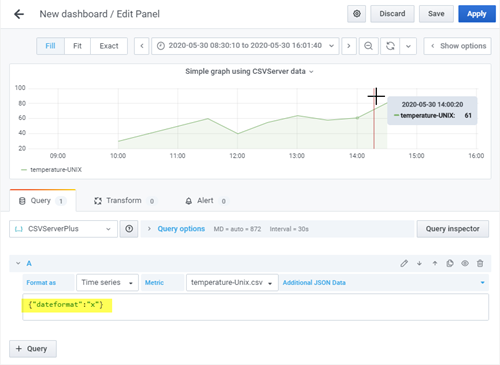
CSV files with Unix timestamp date fields.
The same process applies to CSV files with unix timestamp fields instead of human readable date formatted fields. Consider this sample (Temperature-Unix.csv)
date,temperature-UNIX
1590829220000,30
1590831020000,40
1590832820000,50
1590834620000,60
1590836420000,40
1590838220000,55
1590840020000,64
1590841820000,58
1590843620000,61
1590845420000,81
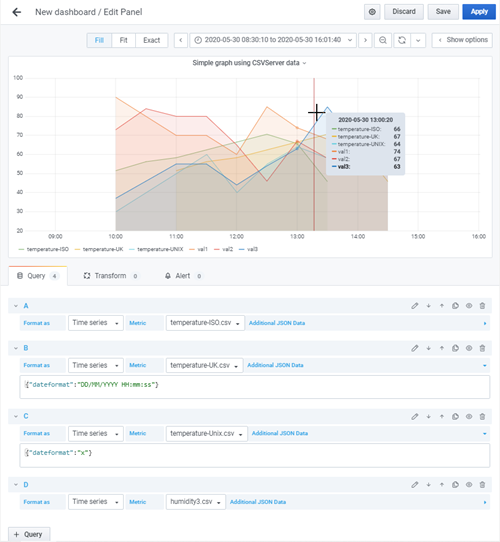
Grafana allows multiple queries to be sent together to the backend datasource, displaying a separate line for each query 'target'. For example, we could display all three of the above CSV data sets on the same graph using a set of three queries like this:
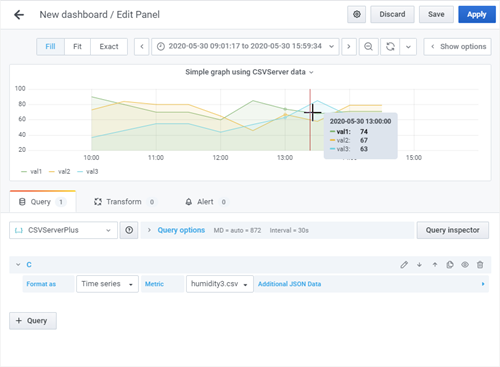
Alternatively, CSV files with more than one value field automatically create lines for each of these fields. The sample data file Humidity3.csv, for example, generates a three line graph from a single query.
val1,val2,date,val3
90,73,2020-05-30 10:00,37
80,84,2020-05-30 10:30,46
70,80,2020-05-30 11:00,55
70,80,2020-05-30 11:30,55
60,65,2020-05-30 12:00,44
85,46,2020-05-30 12:30,54
74,67,2020-05-30 13:00,63
68,58,2020-05-30 13:30,85
71,79,2020-05-30 14:00,65
71,79,2020-05-30 14:30,65
These can be combined too, making (in this case) a 6 line graph from 4 CSV files