Implementing the Simple Linear Regression algorithm over the dataset given below
Dataset: https://s3.us-west-2.amazonaws.com/public.gamelab.fun/dataset/salary_data.csv
What is Linear?
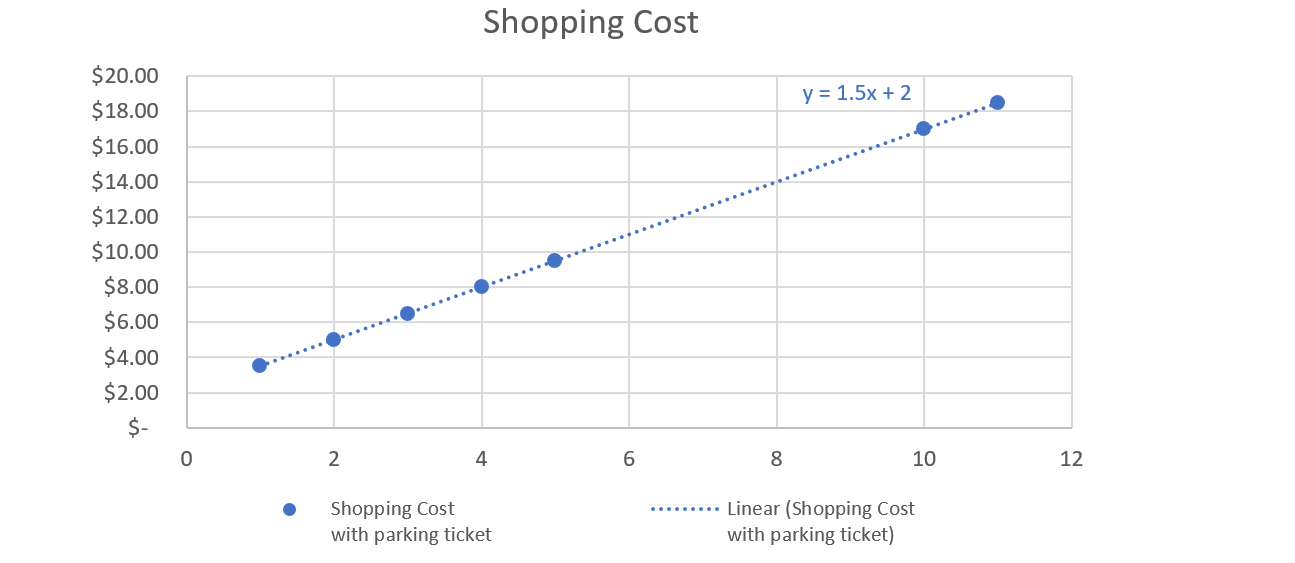
First, let’s say that you are shopping at Walmart. Whether you buy goods or not, you have to pay $2.00 for parking ticket. Each apple price $1.5, and you have to buy an (x) item of apple. Then we can populate a price list as below:
Price list - https://miro.medium.com/max/765/1*Omu6iJl1GuykwHP5x8IkTg.png
It’s easy to predict (or calculate) the Price based on Value and vice versa using the equation of y=2+1.5x for this example or:
y = a + bx
with:
a = 2
b = 1.5
A linear function has one independent variable and one dependent variable. The independent variable is x and the dependent variable is y. a is the constant term or the y intercept. It is the value of the dependent variable when x = 0. b is the coefficient of the independent variable. It is also known as the slope and gives the rate of change of the dependent variable. Why we call it linear? Alright, let’s visualize the data set we got above!
Graph - https://miro.medium.com/max/3000/1*lJAUpLSlcReLEkAwSXbG1A.png
After plotting all value of the shopping cost (in blue line), you can see, they all are in one line, that’s why we call it linear. With the equation of linear (y=a+bx), the a is an independent variable. Even if a=0 (you have no need to pay for the parking ticket), the Shopping Cost line will shift down and they are still in a line (orange line).
Table and Graph - https://miro.medium.com/max/875/1*uYDswmQMj-YbxAVLJ2RtGA.png