Demo video walkthrough:
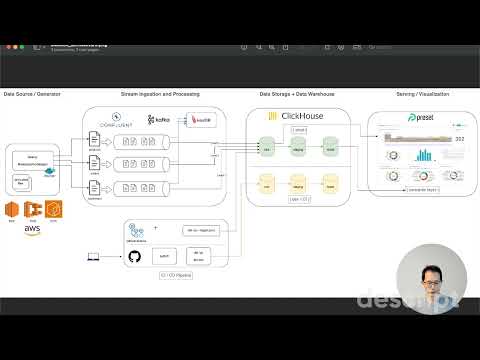
This was my Capstone Project for the Data Engineering Bootcamp, to create a streaming ELT pipeline using Kafka, Confluent Cloud, ClickHouse, dbt and Preset.
It demonstrates designing streaming data pipelines and an analytical data warehouse for an e-commerce store.
- data sources:
Product,OrderandCustomercorrespond to simulated records from operational databases from an e-commerce store - stream processing using ksqldb
- raw data is also streamed into ClickHouse Cloud
- dimensional data modeling using dbt: (i) fact and dimension tables, (ii) one-big-table to provide the semantic layer for BI dashboards, data exploration and report generation
- visualization using Preset
- CI/CD using GitHub Actions
Business process modeling
- We model the e-commerce orders creation business process to ingest, process and visualize real-time orders and total revenue over time, segmented by
- products and categories
- customers
What users would find your dataset useful?
- for the Finance and Operations departments, provide a sales report of the orders over time. Provide the ability to slice by product name, product category and product supplier.
- for the Operations department, provide a report of the shipping delay from order creation to shipping completion.
- for the Marketing department, provide a report of the customers who generated the most revenue to create marketing campaigns and loyalty programmes.
- for the Analytics department, provide raw and modelled data to build machine learning models to provide recommendations to customers to maximise total lifetime value.


- Sign up for a free Confluent trial
- Create a Kafka cluster in Confluent Cloud and generate an API key
- Create topics
products,orders,customers,shipments, andshops - Clone
.env.exampleinto.envand fill in the Kafka cluster credentialssource .env
-
Run datagen locally using pre-built Docker container image
docker pull materialize/datagen
-
Produce the bootstrapped
productsandcustomersrecords (100 products and 50 customers)docker run \ --rm -it \ -v ${PWD}/.env:/app/.env \ -v ${PWD}/datagen/ecommerce_bootstrap_shops_and_customers.json:/app/ecommerce_bootstrap_shops_and_customers.json \ materialize/datagen -s ecommerce_bootstrap_shops_and_customers.json -n 1
-
Verify that new records are generated in the respective topics in the Kafka cluster in Confluent Cloud
-
Whenever needed, you can generate a random number of new
ordersrecords and produce to Kafkanum_orders=$((1 + RANDOM % 100)) docker run \ --rm -it \ -v ${PWD}/.env:/app/.env \ -v ${PWD}/datagen/ecommerce_orders_recent.json:/app/ecommerce_orders_recent.json \ materialize/datagen -s ecommerce_orders_recent.json -n ${num_orders}
-
Provision an EC2 instance in AWS
- The AMI should be an Amazon Linux 2 AMI, with kernel 5.10 and ARM architecture
- A
t4g.microinstance on the free-tier should suffice - Install
dockeron the EC2 instance. Reference: How to install Docker on Amazon Linux 2 - Optional Reference: How to Install Postgresql 14 on EC2 Amazon linux 2
-
Copy the following files into the EC2 instance in the
$HOMEdirectory in EC2 instancescp -i ~/.ssh/global-economic-monitor-cluster-keypair.pem .env \ ec2-user@${EC2_INSTANCE_PUBLIC_DNS_URL}:/home/ec2-user scp -i ~/.ssh/global-economic-monitor-cluster-keypair.pem datagen/*.json \ ec2-user@${EC2_INSTANCE_PUBLIC_DNS_URL}:/home/ec2-user
-
Pull the pre-built Docker container image from DockerHub
docker pull materialize/datagen
-
Verify that the Docker container can be used to produce data to Confluent Cloud
- Generate bootstrapped data for some shops and customers
docker run \
-v ${HOME}/.env:/app/.env \
-v ${HOME}/ecommerce_bootstrap_shops_and_customers.json:/app/ecommerce_bootstrap_shops_and_customers.json \
    materialize/datagen -s ecommerce_bootstrap_shops_and_customers.json -n 1
- Generate seed data for some orders and shipments for the month of
2024-01.
docker run \
-v ${HOME}/.env:/app/.env \
-v ${HOME}/ecommerce_orders_shipments_202401.json:/app/ecommerce_orders_shipments_202401.json \
    materialize/datagen -s ecommerce_orders_shipments_202401.json -n 500
- To generate data for different months, clone and update the
ecommerce_orders_shipments_202401.jsonfile.
cat ecommerce_orders_shipments_202401.json | sed 's\2024-01\2024-02\g' > ecommerce_orders_shipments_202402.json
- Generate data for some recent orders in the past few days
docker run \
-v ${HOME}/.env:/app/.env \
-v ${HOME}/ecommerce_orders_recent.json:/app/ecommerce_orders_recent.json \
    materialize/datagen -s ecommerce_orders_recent.json -n 50
-
To automate this data generation, create a Shell script and schedule it to produce data periodically
-
Create the script:
vi stream_produce.shand paste the following:now="$(date +"%T")" echo "Current Time: $now" echo "Running 'datagen ecommerce_orders_recent.json'" #!/usr/bin/env bash num_orders=$((1 + RANDOM % 20)) docker run \ -v ${HOME}/.env:/app/.env \ -v ${HOME}/ecommerce_orders_recent.json:/app/ecommerce_orders_recent.json \ materialize/datagen -s ecommerce_orders_recent.json -n ${num_orders} echo "All done"
-
Execute the shell script to verify that it works
sh stream_produce.sh
-
Set up crontab to run this shell script every 2 minutes (or some other internal you prefer)
crontab -e
*/2 * * * * sh $HOME/stream_produce.sh >> $HOME/cron.log
-
Verify that the Kafka cluster sees new orders produced every 2 minutes
-
The above setup produces data periodically to Confluent Cloud
- This effectively simulates a periodic ECS task, or a Confluent
Datagen SourceKafka connector - But generates more customizable and realistic-looking data
- This effectively simulates a periodic ECS task, or a Confluent
-
- Sign up for a ClickHouse trial.
- Create a ClickHouse database
ecommerce_etl_devCREATE DATABASE ecommerce_etl_dev
- Create the following tables - the queries to create these are in the
warehouse/clickhouse/table-definitionsfolder:productscustomersordersshipments
- For each of the above tables, create a Clickpipe using the Kafka cluster credentials and bootstrap server URL in the Confluent Cloud UI

- Note: the
shipments,shipment_dispatchesandshipment_completionstopics in Kafka can all be mapped to theshipmentstable in ClickHouse, as these follow the same schema and are meant for accumulating fact tables.
- Note: the
- After the data in Kafka has been populated, you can run some example queries in the
warehouse/clickhouse/queriesfolder- These queries will also be materialized via dbt as
intermediatemodels in a later section
- These queries will also be materialized via dbt as

-
This project has been configured to run dbt via Github Actions, in the
.github/workflowsdirectorydbt-test.ymlwill run models and tests against adevdatabase in ClickHousedbt-run-on-merge.ymlwill run models against aproddatabase in ClickHouse with much larger data volume
-
However, for local development and testing, you can also build and run dbt models against a
devdatabase in ClickHouse
# NOTE: This project has only been tested against Python 3.10.
# Python 3.12 will likely not work, due to library dependencies. Your mileage may vary.
conda create -n "python3_10" python=3.10

python -m pip install -r transform/dbt/requirements.txt

dbt run --project-dir transform/dbt/ecommerce_etl --profiles-dir transform/dbt/ecommerce_etl

dbt test --project-dir transform/dbt/ecommerce_etl --profiles-dir transform/dbt/ecommerce_etl

sqlfluff lint transform/dbt/ecommerce_etl-
You can subsequent verify the
martdata models via ClickHouse queries, e.g.SELECT * FROM "report_orders" LIMIT 10
-
After the dbt models have been verified in the
defaultdatabase, proceed to- create the corresponding tables in a
proddatabase in ClickHouse - create the corresponding Clickpipes to set up data streaming from the respective topics in Kafka.
- create the corresponding tables in a
- Sign up for a Preset trial
- Over in ClickHouse, obtain the connection credentials to your target database and configure a new Preset database connection to point to ClickHouse
- Create a dataset for the
report_orderstable (one big table) which serves as the semantic layer to explore the various facts and dimensions of theordersmodel - Create a Preset dashboard and some charts to generate reports. Example charts:
- total revenue sliced by
product_idover time (monthly grain) - total revenue per
customer_id - total quantity of products purchased per
customer_id
- total revenue sliced by
- Preset visualization of ClickHouse data can be configured to be automatically refreshed with new streaming data and dimensionally-modelled data
(more details in CHANGELOG.md)
-
Stream ingestion of
ordersinto Kafka cluster in Confluent Cloud
-
Stream-to-stream join queries using ksqldb with a 24-hour window


-
Data Lineage

-
Star-schema Entity-Relationship Diagram


-
On creating/updating a pull request to
main, runsqlflufflinter anddbt testpointing todevClickHouse tables -
On merge to
main, rundbt run --target prodto updateprodClickHouse tables
